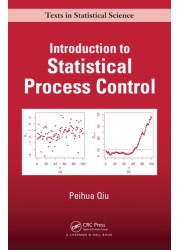
Introduction to Statistical Process Control
Quantity:
-
Add to Compare
A major tool for quality control and management, statistical process control (SPC) monitors sequential processes, such as production lines and Internet traffic, to ensure that they work stably and satisfactorily. Along with covering traditional methods, Introduction to Statistical Process Controldescribes many recent SPC methods that improve upon the more established techniques. The author—a leading researcher on SPC—shows how these methods can handle new applications.
After exploring the role of SPC and other statistical methods in quality control and management, the book covers basic statistical concepts and methods useful in SPC. It then systematically describes traditional SPC charts, including the Shewhart, CUSUM, and EWMA charts, as well as recent control charts based on change-point detection and fundamental multivariate SPC charts under the normality assumption. The text also introduces novel univariate and multivariate control charts for cases when the normality assumption is invalid and discusses control charts for profile monitoring
Table of Contents
Introduction
Quality and the Early History of Quality Improvement
Quality Management
Statistical Process Control
Organization of the Book
Basic Statistical Concepts and Methods
Introduction
Population and Population Distribution
Important Continuous Distributions
Important Discrete Distributions
Data and Data Description
Tabular and Graphical Methods for Describing Data
Parametric Statistical Inferences
Nonparametric Statistical Inferences
Univariate Shewhart Charts and Process Capability
Introduction
Shewhart Charts for Numerical Variables
Shewhart Charts for Categorical Variables
Process Capability Analysis
Some Discussions
Univariate CUSUM Charts
Introduction
Monitoring the Mean of a Normal Process
Monitoring the Variance of a Normal Process
CUSUM Charts for Distributions in Exponential Family
Self-Starting and Adaptive CUSUM Charts
Some Theory for Computing ARL Values
Some Discussions
Univariate EWMA Charts
Introduction
Monitoring the Mean of a Normal Process
Monitoring the Variance of a Normal Process
Self-Starting and Adaptive EWMA Charts
Some Discussions
Univariate Control Charts by Change-Point Detection
Introduction
Univariate Change-Point Detection
Control Charts by Change-Point Detection
Some Discussions
Multivariate Statistical Process Control
Introduction
Multivariate Shewhart Charts
Multivariate CUSUM Charts
Multivariate EWMA Charts
Multivariate Control Charts by Change-Point Detection
Multivariate Control Charts by LASSO
Some Discussions
Univariate Nonparametric Process Control
Introduction
Rank-Based Nonparametric Control Charts
Nonparametric SPC by Categorical Data Analysis
Some Discussions
Multivariate Nonparametric Process Control
Introduction
Rank-Based Multivariate Nonparametric Control Charts
Multivariate Nonparametric SPC by Log-Linear Modeling
Some Discussions
Profile Monitoring
Introduction
Parametric Profile Monitoring
Nonparametric Profile Monitoring
Some Discussions
Appendix A: R Functions for SPC
Appendix B: Datasets Used in the Book
Bibliography
Index
Write a review
Your Name:Your Review: Note: HTML is not translated!
Rating: Bad Good
Enter the code in the box below:
Copyright © 2014 Engineering Standards Bureau. All Rights Reserved.
Developed By Zoom Into Web


