Your shopping cart is empty!
Welcome visitor you can login or create an account
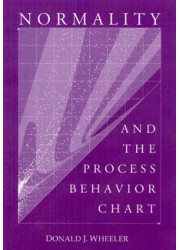
Normality and the Process Behavior Chart
Our Price: $30.00
Quantity:
Add to Compare
Having a normally shaped histogram is not a prerequisite for placing your data on a process behavior chart. Neither is it inevitable that a predictable process will display a mound shaped histogram.
This book provides the first careful and complete examination of the relationship between the normal distribution and the process behavior chart. It clears up much of the confusion surrounding this subject, and it can help you overcome the superstitions that have hampered the effective use of process behavior charts.
Topics include:
- the history of the normal distribution and early attempts to use it to analyze data
- the shortcomings of goodness-of-fit tests
- how to really compute parts-per-million defect rates
- the fundamental difference between theory and practice
- the relationship between R&D and SPC
- the linkage between the normal distribution and basic constants in chart formulas
- how non-normal distributions affect these basic constants
- how three-sigma limits work with over 1100 different probability models
- the shortcomings of average run lengths as a tool for sensitivity analysis
Price subject to change without notice
Copyright © 2014 Engineering Standards Bureau. All Rights Reserved.
Developed By Zoom Into Web
Copyright © 2014 Engineering Standards Bureau. All Rights Reserved.
Developed By Zoom Into Web


