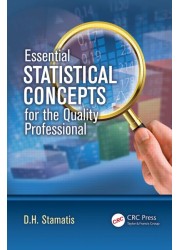
Essential Statistical Concepts for the Quality Professional
Quantity:
-
Add to Compare
The essence of any root cause analysis in our modern quality thinking is to go beyond the actual problem. This means not only do we have to fix the problem at hand but we also have to identify why the failure occurred and what was the opportunity to apply the appropriate knowledge to avoid the problem in the future. Essential Statistical Concepts for the Quality Professional offers a new non-technical statistical approach to quality for effective improvement and productivity by focusing on very specific and fundamental methodologies and tools for the future.
Written by an expert with more than 30 years of experience in management, quality training, and consulting, the book examines the fundamentals of statistical understanding, and by doing so demonstrates the importance of using statistics in the decision making process. The author points out pitfalls to keep in mind when undertaking an experiment for improvement and explains how to use statistics in improvement endeavors. He discusses data interpretation, common tests and confidence intervals, and how to plan experiments for improvement. The book expands the notion of experimentation by dealing with mathematical models such as regression to optimize the improvement and understand the relationship between several factors. It emphasizes the need for sampling and introduces specific techniques to make sure accuracy and precision of the data is appropriate and applicable for the study at hand.
The author’s approach is somewhat new and unique; however, he details tools and methodologies that can be used to evaluate the system for prevention. These tools and methodologies focus on structured, repeatable processes that can be instrumental in finding real, fixable causes of the human errors and equipment failures that lead to quality issues.
Table of Contents
What Is Statistics?
Deductive and Inductive Statistics
The Stages of a Sample Study
Warning!!!
Control the Data
Significance Testing
Wrong Signs
Summary
References
Selected Bibliography
Data
Describing Data
Data Orientation
Nominal, Ordinal, Interval, and Ratio
Sampling Considerations
The Frequency of the Sample
Degrees of Freedom
Where Do I Start?
What Is a P-Value?
Assessing Normality
Summary
Selected Bibliography
Summarizing Data
Frequency Distributions
Dot Plots
Stem and Leaf Displays
Box Plots
Descriptive Statistics
Measures of Dispersion
Normality
Areas in the Normal Distribution
Standard Score
A Sample from the Normal Distribution
Distributions that Aren’t Normal
The Standard Error of the Mean
Tests of Distributions as a Whole
Transformations to Obtain Normality
Confidence and Sensitivity
Test for Independence in Contingency Tables
Summary
References
Selected Bibliography
Tests and Confidence Intervals for Means
Test for μ When σ Is Known
Test for μ When σ Is Unknown
Test for μ − μ When σ and σ Are Known
Test for μ − μ When σ and σ Are Unknown
Test for Two Independent Samples When σ = σ
Test of μ − μ = for Two Independent Samples When σ ≠ σ
Test for Differences Between Proportions p – p
Test for Differences Among Several Means
Detection of a Trend in a Set of Means with Standard Deviations
Unknown but Assumed Equal
Summary
Selected Bibliography
Tests and Confidence Intervals for Standard Deviations
Computation and Understanding s and σ
Chi-Square Test for σ in a Normal Distribution
F-Test for σ/σ for Normal Distributions
M-Test for Homogeneity of Variances
Summary
Selected Bibliography
Tests of Distributions and Means
Underlying Distribution Analysis
Methods of Testing for Underlying Distributions
Probability Plotting
Selected Tests
Summary
References
Selected Bibliography
Understanding and Planning the Experiment and Analysis of Variance
Understanding the Fundamentals of Experimentation
Planning the Process
Data Analysis versus Statistical Analysis
Analysis of Variance
Hypothesis Testing
Calculating the F-Ratio
Multiple-Comparison Procedures
Interactions
How Can You Test the Null Hypothesis that Several Population
Means Are Equal?
Special Considerations
Types of Analysis of Variance
Taguchi Approach to Design of Experiments
Summary
References
Selected Bibliography
Newer Sources
Fitting Functions
Selecting Dependent Variables
Selecting Independent Variables
Correlation Analysis
Regression
Step Regression
General Linear Model
Discriminant Analysis
Log-Linear Models
Logistic Regression
Factor Analysis
Cluster Analysis
Testing Hypothesis About Many Means
Conjoint Analysis
Multiple Regression
Partial Regression
After Regression
Summary
References
Selected Bibliography
Typical Sampling Techniques
Notation and Formula for the Hypergeometric Distribution
Binomial Experiment
Notation and Formula
Binomial Distribution
Cumulative Binomial Probability
Types of Acceptance Plans
Definitions of Basic Acceptance Plans
The Final Choice Is a Tradeoff Analysis
MIL STD (D and )
Stratified Sampling
Proportionate Versus Disproportionate Stratification
Surveys
Quality of Survey Results
Sample Design
Simple Random Sampling
Cluster Sampling
The Difference between Strata and Clusters
How to Choose the Best Sampling Method
Quality-Control Charts and Sampling
Attributes or Variables
Choice of Plan
Inspection Level
Summary
Selected Bibliography
Understanding Computer Programs for Design and Estimating Design Power
Examples of ANOVA and ANCOVA Models
Key to types of statistical models
Strong Recommendations
Summary
References
Epilogue
Appendix A: Minitab Computer Usage
Appendix B: Formulae Based on Statistical Categories
Appendix C: General Statistical Formulae
Appendix D: Hypothesis Testing Road Map
Appendix E: Test indicators
Appendix F: Hypothesis Testing—Selected Explanations and Examples
Appendix G: When to Use Quality Tools—A Selected List
Glossary
Selected Bibliography
Write a review
Your Name:Your Review: Note: HTML is not translated!
Rating: Bad Good
Enter the code in the box below:
Copyright © 2014 Engineering Standards Bureau. All Rights Reserved.
Developed By Zoom Into Web


